Top 10 Green Machine Optical Sorters for Global Buyers
Global buyers are reassessing optical sorting as waste volumes rise and recycling targets become more demanding. The World Bank’s What a Waste 2.0 report estimated 2.01 billion tonnes of municipal solid waste in 2016. It projects 3.40 billion tonnes annually by 2050 without stronger waste-management action. UNEP’s Global Waste Management Outlook 2024 presents a similar warning, linking waste growth with rising economic and environmental costs.
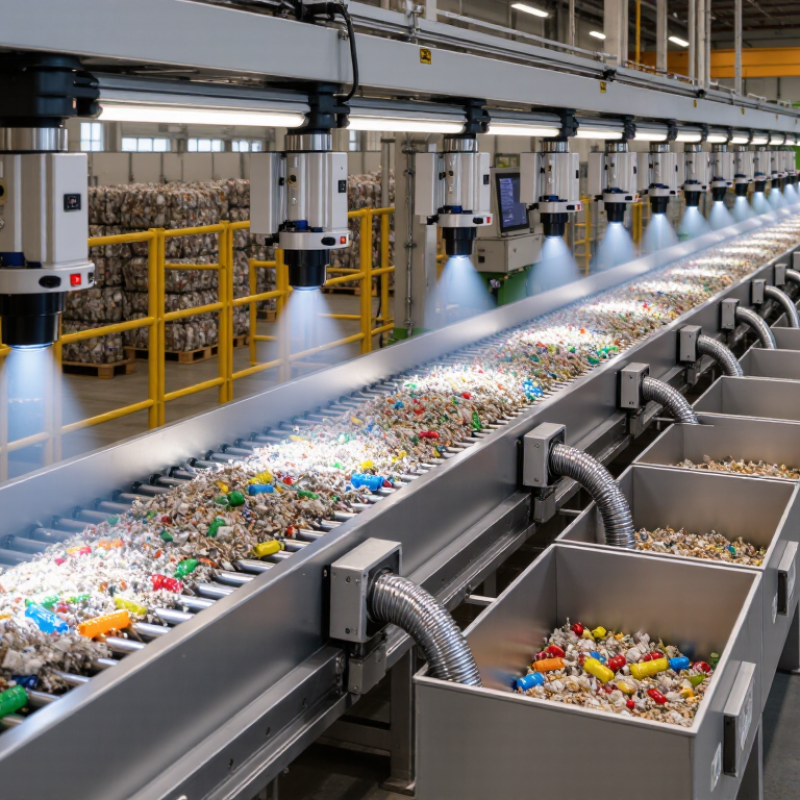
A Green Machine Optical Sorter can turn that pressure into a practical process. Picture a conveyor carrying mixed plastic flakes, colored bottles, paper fibers, and small metal fragments. Cameras, sensors, software, and air jets separate materials within milliseconds. The result depends on more than machine speed. Feed consistency, belt cleanliness, lighting, maintenance, and operator training also matter. Sometimes, the “best” sorter performs poorly in a badly prepared line.
Andrew Morlet, Chief Executive of the Ellen MacArthur Foundation, described the wider challenge clearly: “The circular economy is a systems solution framework that tackles global challenges like climate change, biodiversity loss, waste, and pollution.” This principle matters when comparing the Top 10 Green Machine Optical Sorters for Global Buyers. Buyers should examine recovery rates, purity, energy use, service coverage, data transparency, and compatibility with local materials. Published figures are not always directly comparable. That limitation deserves attention. A laboratory result may look impressive, yet a dusty facility with unstable feedstock can produce a different outcome. This guide evaluates leading options through technical performance, operating experience, supplier credibility, and long-term value.
What Green Machine Optical Sorters Are and How They Work
Green machine optical sorters are automated systems that identify and separate materials on a moving conveyor. The term “green machine” is not a formal engineering standard. It usually describes sorting equipment designed to recover valuable materials while reducing waste, energy use, or manual handling.
Cameras, near-infrared sensors, and laser systems inspect each item within milliseconds. Software compares color, shape, reflectance, and material signatures. Air jets then eject selected pieces into separate bins. A plastic flake may pass beneath the sensor, receive a digital classification, and move into a recovery stream before the next item arrives. Small details matter. Dirty surfaces, overlapping objects, moisture, and dark pigments can reduce accuracy.
The United Nations Global E-waste Monitor 2024 reported 62 million tonnes of electronic waste in 2022. It projects 82 million tonnes by 2030. The report also recorded only a 22.3% documented recycling rate in 2022. These figures show why precise separation matters. UNEP’s Global Waste Management Outlook 2024 estimates municipal solid waste could rise from 2.3 billion tonnes in 2023 to 3.8 billion tonnes by 2050.
Performance is not automatic. Feed speed, lighting, calibration, and material preparation strongly affect results. A sorter may achieve impressive laboratory accuracy but perform differently in a dusty plant. Buyers should request site trials, contamination data, recovery rates, and energy figures. “Green” should be measured, not assumed.
Top 10 Green Machine Optical Sorters for Global Buyers
What Green Machine Optical Sorters Are and How They Work
Optical sorters use cameras, near-infrared sensors, color detection and air jets to identify and separate recyclable materials on a conveyor belt. The chart shows representative target-purity ranges commonly associated with different material streams after optical sorting. Actual results depend on feedstock quality, moisture, belt speed, particle size and machine configuration.
Key Technologies Behind Modern Optical Sorting Systems
Modern optical sorting systems combine imaging, software, and precision air control. RGB cameras detect visible color differences, while near-infrared sensors identify material composition. Hyperspectral imaging adds broader spectral detail, helping separate similar-looking items. Laser systems can expose surface defects, cracks, and foreign particles under changing light. These tools matter as food loss remains significant. The FAO estimates that 14% of food is lost between harvest and retail, while the UNEP Food Waste Index Report 2024 recorded 1.05 billion tonnes of food waste in 2022.
Artificial intelligence now improves classification by learning from thousands of product images. A processor can flag mold, discoloration, stones, plastic, or damaged pieces within milliseconds. Line-scan cameras inspect each item across a moving belt. Compressed-air ejectors then remove selected pieces into separate channels.
Performance depends on more than sensor resolution. Dust, moisture, uneven spacing, and weak lighting can reduce accuracy. Small details matter.
Practical testing remains essential.
Global buyers should request verified data for detection rate, false rejection, throughput, and compressed-air use. Independent trials using local materials are more reliable than showroom demonstrations. A machine trained on dry, clean samples may struggle with wet produce after harvest. That weakness deserves attention. Operators also need simple calibration controls, traceable inspection records, and service support. The best system is not always the fastest one; it is the system that delivers stable results during ordinary production, including difficult shifts and imperfect raw materials.
Top 10 Green Machine Optical Sorters for Global Buyers
Top 10 Green Machine Optical Sorters for Global Buyers
For global buyers, the top 10 green machine optical sorters should be judged by recovery quality, energy use, and service access. Modern systems use near-infrared sensors, color cameras, and air jets to identify plastics, paper, metals, and contaminants. A clear conveyor image matters. So does a stable compressed-air supply.
UNEP’s Global Waste Management Outlook 2024 estimates that municipal solid waste may rise from 2.1 billion tonnes in 2023 to 3.8 billion tonnes by 2050. The pressure is real. The OECD reported that only about 9% of global plastic waste was recycled in 2019. Buyers should therefore compare sorting accuracy, throughput, rejection rates, and data-monitoring functions. A machine handling 8 tonnes per hour may perform poorly if material is wet, dusty, or poorly spread. This detail is often underestimated.
Tips: Request test results using your own feedstock. Ask for accuracy data at different belt speeds. Check spare-part delivery times, operator training, and local electrical compatibility. A low purchase price can hide expensive maintenance. Also, do not trust every “green” claim without measured power data. Independent verification is better.
Experience from recycling plants shows that calibration changes with lighting, material color, and belt cleanliness. The best system on paper may not be the best fit onsite. Buyers should leave room for uncertainty and reassess performance after installation.
How to Compare Sorting Accuracy, Capacity, and Energy Use
Comparing the top ten optical sorters requires more than reading a claimed accuracy percentage. Ask how accuracy was measured, including material type, moisture level, particle size, and defect rate. A controlled test with your own samples is more useful than a showroom demonstration. Inspect rejected and accepted streams by hand. Record false rejects, false accepts, belt speed, and lighting changes. Small errors become expensive.
Capacity must match the complete processing line, not just the sorter’s headline throughput. Measure kilograms per hour at your actual feed density. Check hopper loading, conveyor width, air-jet response, and cleaning intervals. A machine rated for high volume may slow when material is wet, dusty, or uneven. Leave operating headroom. Running at the limit can reduce accuracy and increase maintenance. The first comparison often looks cleaner than reality.
Energy use deserves a direct calculation. Compare kilowatt-hours per tonne, including compressors, conveyors, sensors, and standby demand. Request logged data from a comparable installation, preferably verified by an independent technician. Precise valve timing may reduce compressed-air use, but savings depend on calibration and pressure settings. Check service access, software updates, spare-part availability, and operator training in your region. No sorter is perfect. Score accuracy, capacity, energy, and downtime together, then repeat the test after installation.
Top 10 Green Machine Optical Sorters for Global Buyers - How to Compare Sorting Accuracy, Capacity, and Energy Use
Comparative benchmark for resource-efficient optical sorting systems used in recycling and material recovery applications
Indicative operating specifications under controlled test conditions. Actual results vary with feed composition, moisture, particle size, belt speed, and contamination levels. | Rank | Anonymous System | Primary Application | Detection Technology | Typical Feed Size
(mm) | Capacity
(t/h) | Sorting Accuracy
(%) | Recovery Rate
(%) | Energy Use
(kWh/t) | Compressed Air
(Nm³/t) | Indicative Sustainability Score
(100) |
| 1 | System 01 | Mixed plastic packaging | NIR + RGB camera + AI classification | 20–300 | 8–12 | 94–98 | 90–96 | 0.18–0.28 | 0.9–1.4 | 94 |
| 2 | System 02 | PET bottle sorting | NIR + shape and color recognition | 30–350 | 7–11 | 95–99 | 92–97 | 0.16–0.25 | 0.8–1.3 | 93 |
| 3 | System 03 | Paper and cardboard recovery | NIR + visible-light camera | 50–500 | 10–16 | 92–97 | 89–95 | 0.14–0.23 | 0.7–1.2 | 92 |
| 4 | System 04 | Color-sorted plastic flakes | High-resolution RGB camera + air ejection | 2–20 | 2–5 | 96–99.5 | 93–98 | 0.22–0.38 | 1.1–2.0 | 91 |
| 5 | System 05 | Glass color separation | RGB camera + laser profile detection | 10–80 | 8–15 | 93–98 | 91–97 | 0.12–0.22 | 0.8–1.5 | 90 |
| 6 | System 06 | Textile and fiber identification | NIR spectroscopy + machine vision | 30–250 | 4–8 | 90–96 | 86–93 | 0.20–0.34 | 1.0–1.8 | 87 |
| 7 | System 07 | Wood and organic fraction | NIR + shape recognition | 40–400 | 8–14 | 88–94 | 84–91 | 0.17–0.29 | 0.9–1.6 | 85 |
| 8 | System 08 | Construction and demolition waste | Color camera + NIR + object recognition | 50–600 | 10–18 | 85–93 | 80–89 | 0.16–0.30 | 0.8–1.7 | 83 |
| 9 | System 09 | Aluminum and non-ferrous metals | Induction sensor + color camera | 20–250 | 6–12 | 92–97 | 88–95 | 0.13–0.24 | 0.7–1.3 | 82 |
| 10 | System 10 | Fine mixed municipal waste | Multispectral camera + AI classification | 10–120 | 3–7 | 84–92 | 78–88 | 0.24–0.42 | 1.2–2.3 | 79 |
How to interpret the comparison: Accuracy indicates the percentage of accepted product meeting the specified target classification. Recovery indicates the share of target material successfully recovered from the input stream. Energy use covers the sorter and associated conveyor equipment but excludes upstream shredding, washing, and compressed-air generation. The sustainability score is an indicative weighted index combining accuracy, recovery, energy demand, compressed-air demand, and operating flexibility.
Buying and Operating Considerations for International Markets
Top 10 Green Machine Optical Sorters for Global Buyers
Buying and Operating Considerations for International Markets
For international buyers, a top-ten optical sorter list should begin with measurable operating conditions, not glossy recovery claims. The UNEP Food Waste Index 2024 estimates that 1.05 billion tonnes of food were wasted in 2022. Recycling lines also face rising complexity. The Global E-waste Monitor 2024 recorded 62 million tonnes of e-waste in 2022. These figures support equipment that improves separation while limiting compressed-air, power, and maintenance demand. Ask for trials using your feedstock, moisture range, belt speed, and contamination profile.
For cross-border purchasing, verify voltage, frequency, enclosure ratings, language support, spare-part availability, and technician response times. A sorter calibrated in a dry plant may underperform in humid climates or dusty facilities. Request energy data in kilowatt-hours per tonne, plus reject rates, purity, uptime, and false-positive results. European Commission Joint Research Centre waste-treatment guidance emphasizes performance monitoring and resource efficiency. Do not accept averages alone.
Test locally.
Operating cost can change the ranking. A cheaper unit may lose value through nozzle replacement, imported sensors, or software dependence. Check customs classification, warranty coverage, cybersecurity controls, and training obligations before signing. ISO 14001 procedures can improve environmental documentation, but certification does not guarantee sorting quality. Operators need routine lens cleaning, belt inspections, and calibration checks. We still underestimate training. A practical acceptance test should compare saleable output, residue, energy use, and downtime across several shifts. That evidence is stronger than a polished demonstration.
Record hourly variation.